1、需求#
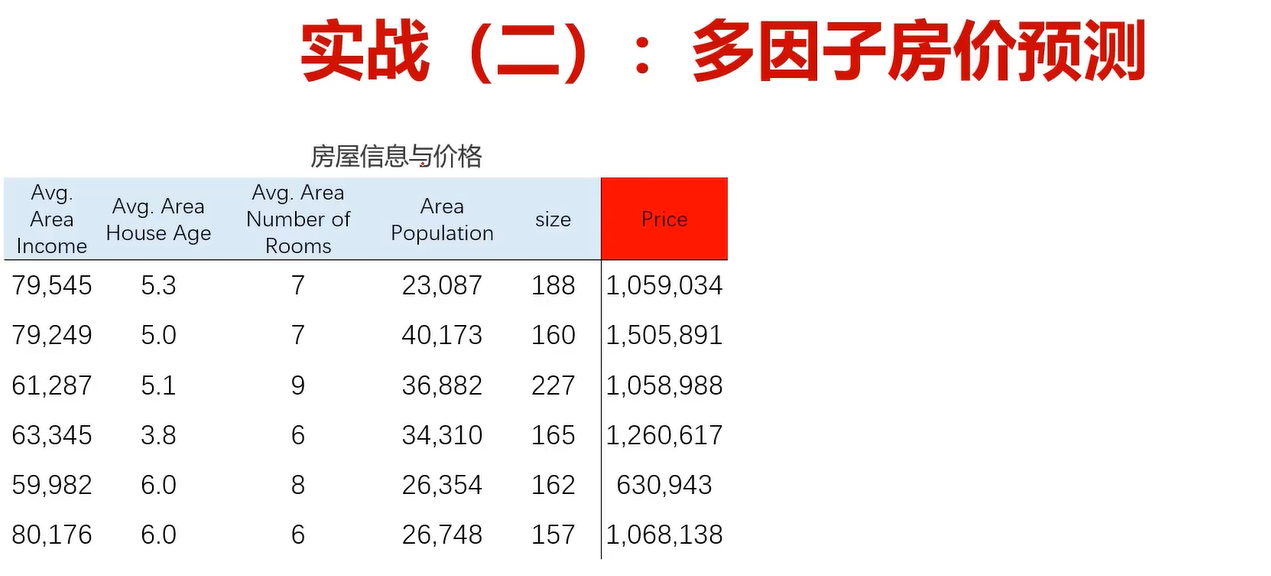
基于 USA_Housing.csv 数据,建立线性回归模型,预测合理房价:
- 以面积为输入变量,建立单因子模型,评估模型表现,可视化线性回归预测结果。
- 以 income、house age、numbers of rooms、population、area 为输入变量,建立多因子模型,评估模型表现。
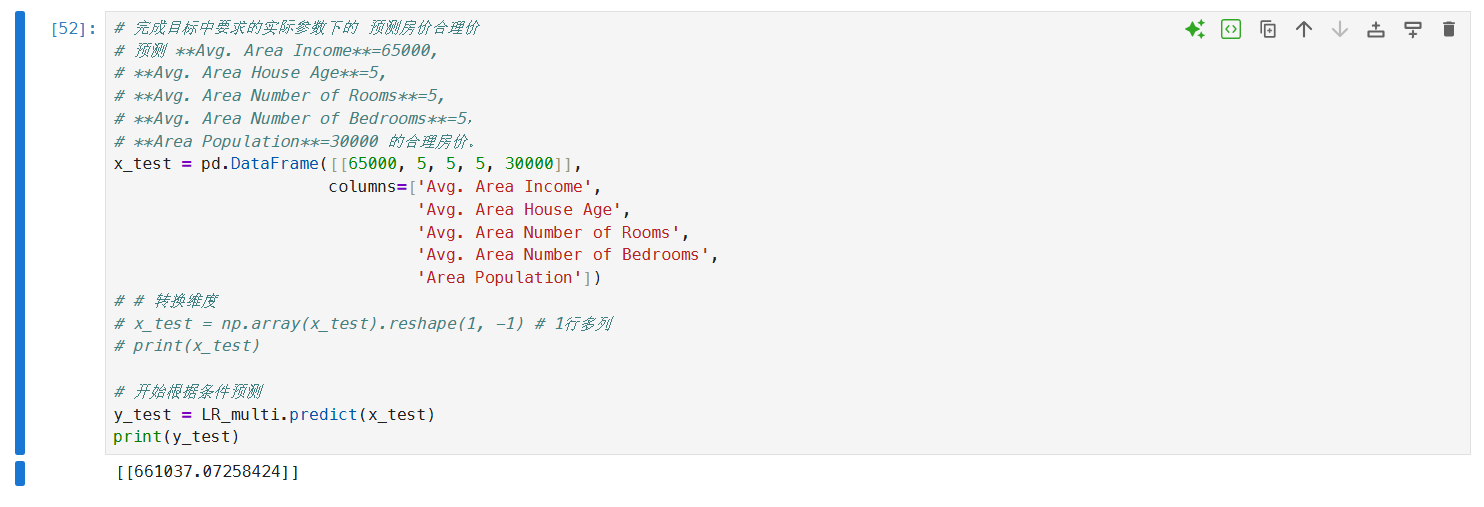
- 预测 Avg. Area Income=65000, Avg. Area House Age=5, Avg. Area Number of Rooms=5, Avg. Area Number of Bedrooms=5, Area Population=30000 的合理房价。
2、数据准备#
略。。。
3、单因子开发#
3.1、准备好数据,预览下#
# load the data
import pandas as pd
data = pd.read_csv('USA_Housing.csv')
data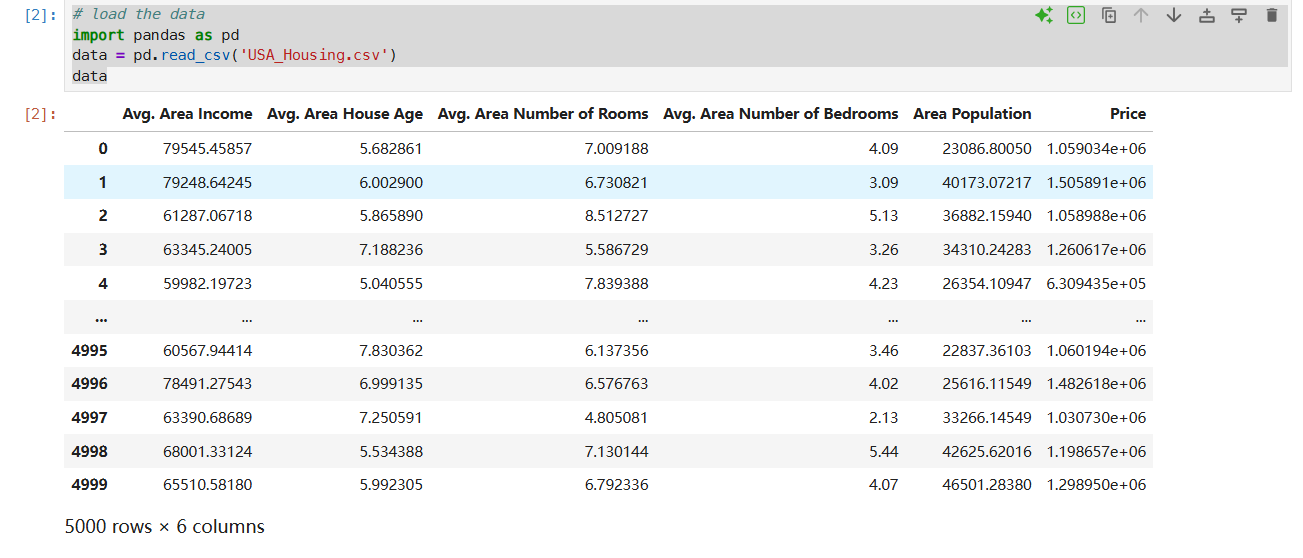
3.2、先寻找Income与Price的关系#
from matplotlib import pyplot as plt
fig = plt.figure(figsize=(10, 10))
fig1 = plt.subplot(231) # 2行3列中的第一个图
plt.scatter(data.loc[:, 'Avg. Area Income'], data.loc[:, 'Price']) # 先观察下 Income 与 Price 的关系
plt.title('Price VS Incom')
plt.show()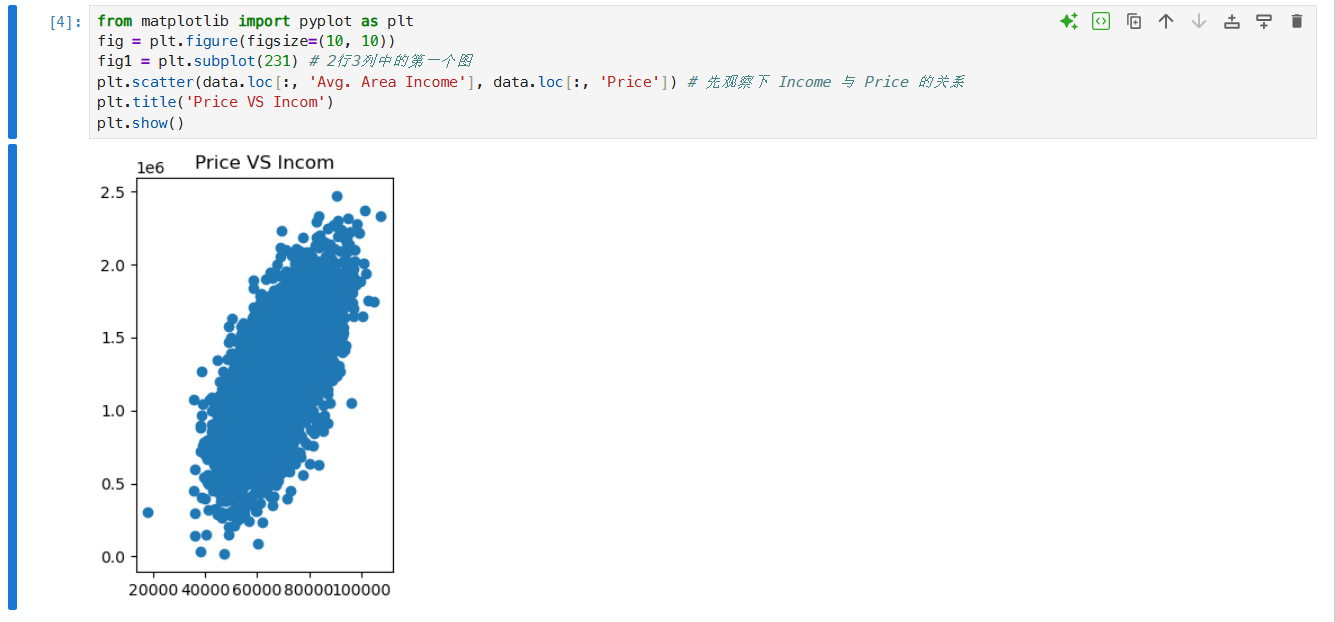
依次画出其它指标与Price的关系:
from matplotlib import pyplot as plt
fig = plt.figure(figsize=(10, 10))
fig1 = plt.subplot(231) # 2行3列中的第一个图
plt.scatter(data.loc[:, 'Avg. Area Income'], data.loc[:, 'Price']) # 先观察下 Income 与 Price 的关系
plt.title('Price VS Incom')

fig2 = plt.subplot(232) # 2行3列中的第二个图
plt.scatter(data.loc[:, 'Avg. Area House Age'], data.loc[:, 'Price']) # 观察下 House Age 与 Price 的关系
plt.title('House Age VS Incom')

fig3 = plt.subplot(233) # 2行3列中的第3个图
plt.scatter(data.loc[:, 'Avg. Area Number of Rooms'], data.loc[:, 'Price'])
plt.title('Number of Rooms VS Incom')

fig4 = plt.subplot(234) # 2行3列中的第4个图
plt.scatter(data.loc[:, 'Avg. Area Number of Bedrooms'], data.loc[:, 'Price'])
plt.title('Number of Bedrooms VS Incom')

fig5 = plt.subplot(235) # 2行3列中的第5个图
plt.scatter(data.loc[:, 'Area Population'], data.loc[:, 'Price'])
plt.title('Area Population VS Incom')

plt.show()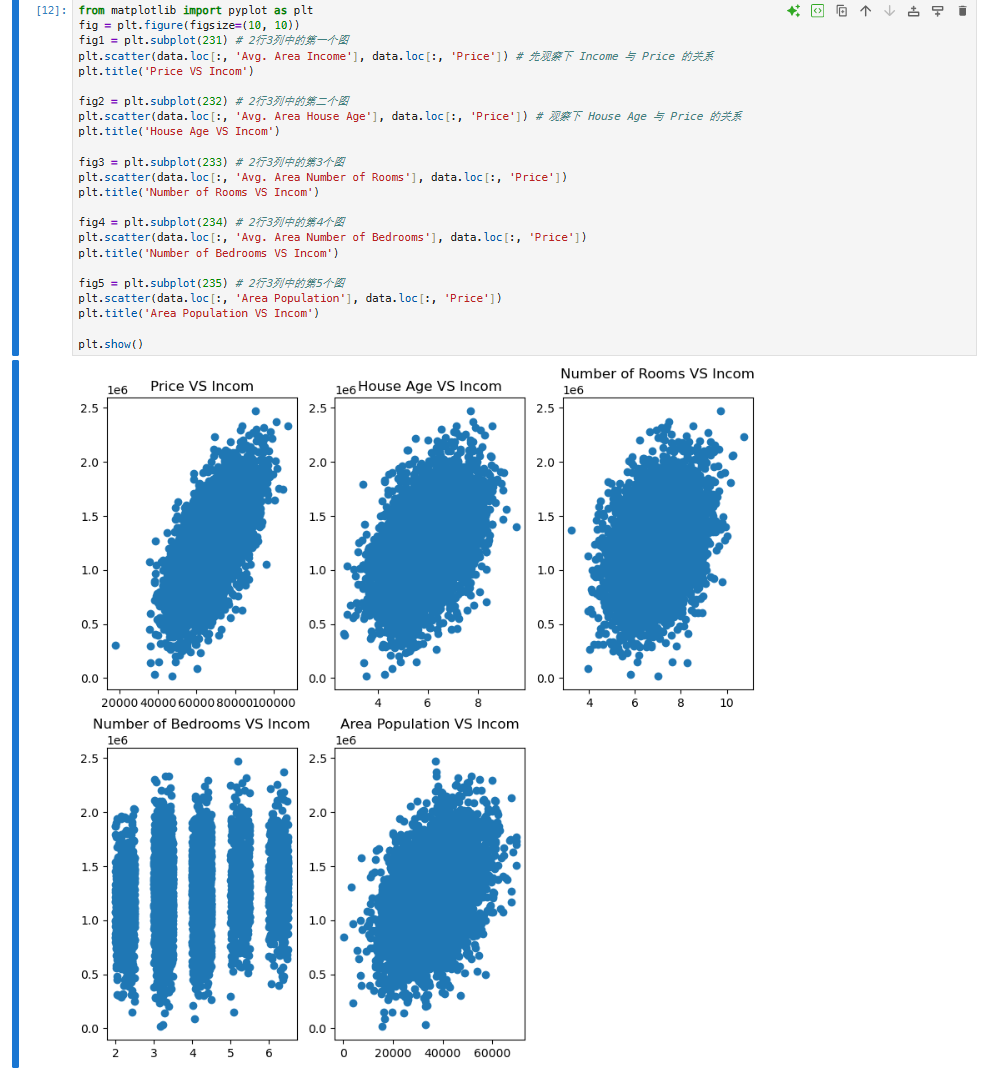
3.3、建立单因子模型#
# 建立单因子模型
# 构造 x y
x = data.loc[:, 'Avg. Area Income']
y = data.loc[:, 'Price']

# 创建线性模型实例
from sklearn.linear_model import LinearRegression
LR1 = LinearRegression()

# 先打印一下 x 的维度
print(x.shape)

# 转换x y 的维度
import numpy as np
x = np.array(x).reshape(-1, 1) # reshape 第一个参数-1表示动态行,第二个参数表示1列
y = np.array(y).reshape(-1, 1)
# 再打印一下转换后的维度
print(x.shape)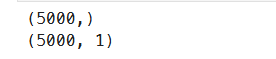
3.4、训练模型#
# 训练模型
LR1.fit(x, y) # 训练之前记得转换x y的维度
3.5、预测单因子时对应的价格#
# 计算单因子时的价格
y_predict_1 = LR1.predict(x)
print(y_predict_1)
3.6、评估模型#
# 评估模型
from sklearn.metrics import mean_squared_error, r2_score
mean_squared_error_1 = mean_squared_error(y, y_predict_1)
r2_score_1 = r2_score(y, y_predict_1)
print(mean_squared_error_1, r2_score_1) # r2_score_1 值越大越好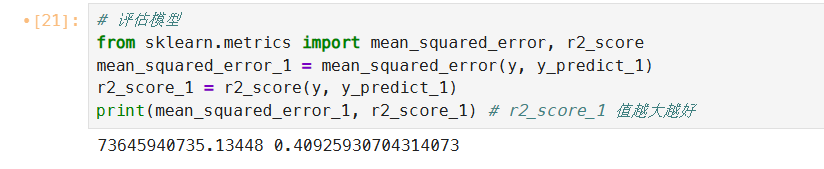
3.7、可视化#
# 可视化
fig6 = plt.figure(figsize=(8, 5))
plt.scatter(x, y)
plt.plot(x, y_predict_1, 'r') # r表示红色线
plt.show()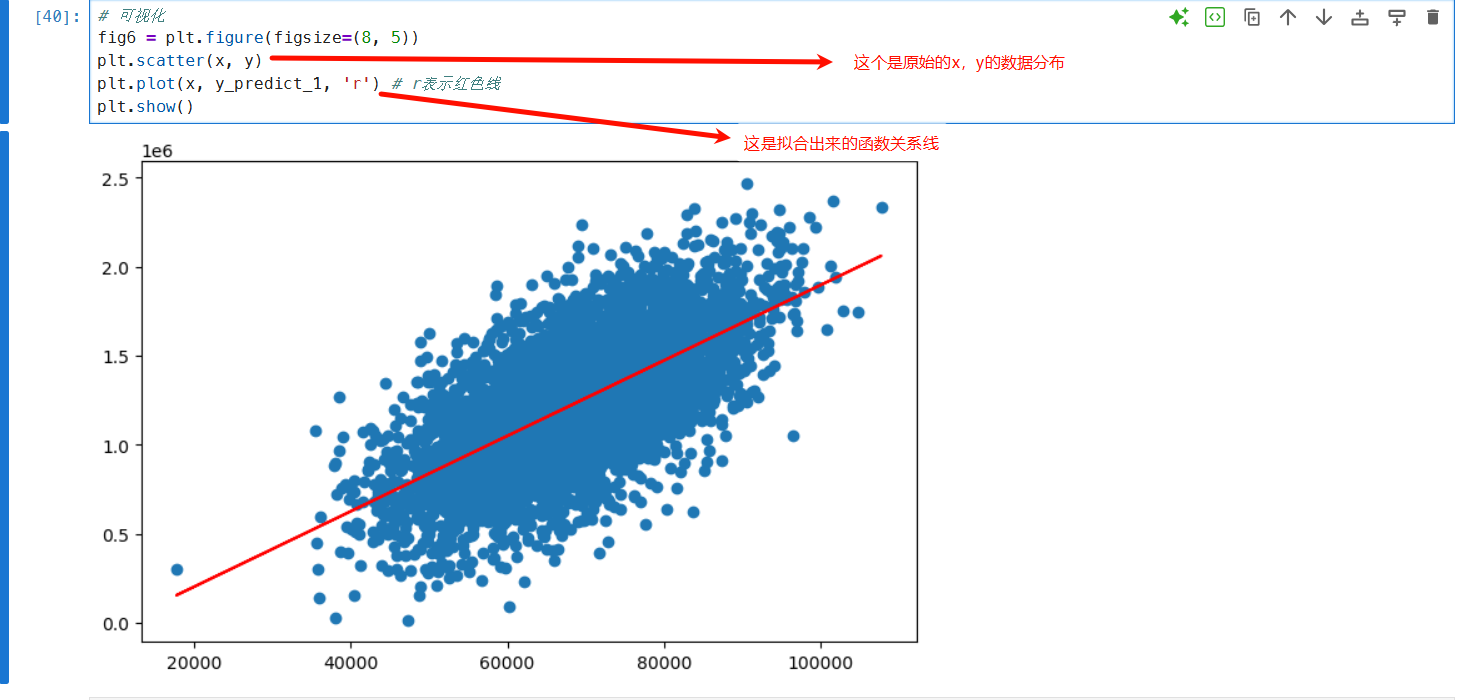
4、多因子开发#
4.1、建立多因子模型#
# 建立多因子模型
# x 重新赋值,x等于data列中去掉 Price 后的所有列的维度
x_multi = data.drop(['Price'], axis=1)
x_multi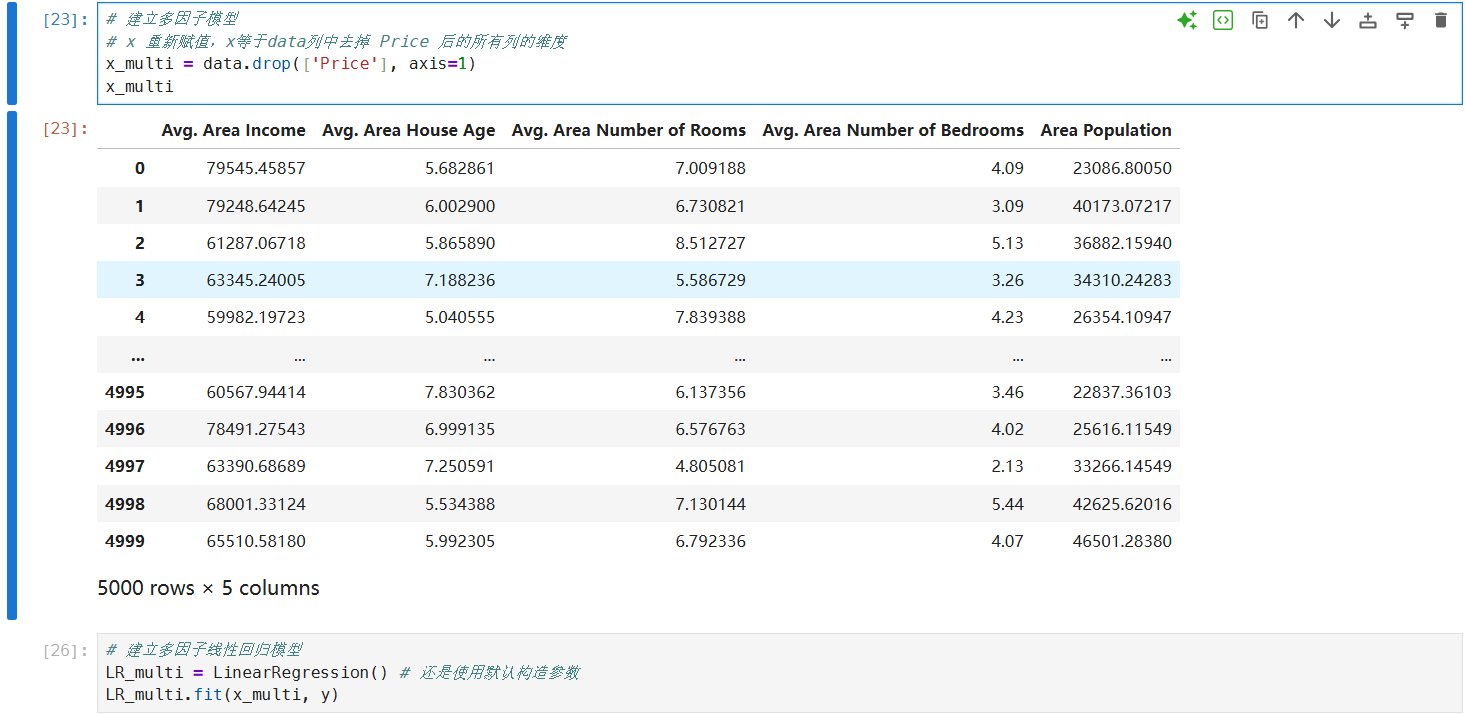
4.2、建立多因子线性回归模型#
# 建立多因子线性回归模型
LR_multi = LinearRegression() # 还是使用默认构造参数
LR_multi.fit(x_multi, y)
4.3、使用多因子模型根据x值预测y值#
# 根据这个多因子的 x 预测一下 相应的 y 值
y_predict_multi = LR_multi.predict(x_multi)4.4、评估模型#
# 评估模型
from sklearn.metrics import mean_squared_error, r2_score
mean_squared_error_multi = mean_squared_error(y, y_predict_multi)
r2_score_multi = r2_score(y, y_predict_multi)
print(mean_squared_error_multi, r2_score_multi) # r2_score_1 值越大越好
4.5、可视化#
# 可视化一下模型,由于是多因子的变量,没法线性化表现出与 y 的关系
# 因此,我们画出 多因子下预测出来的 y_predict_multi 与 原始  y 的差值
fig_multi = plt.figure(figsize=(8, 5))
# plt.scatter(y, y_predict_multi) # 一个是实际的y值,一个是预测的y值
plt.plot(y, y_predict_multi, 'g') # g表示绿线
plt.show()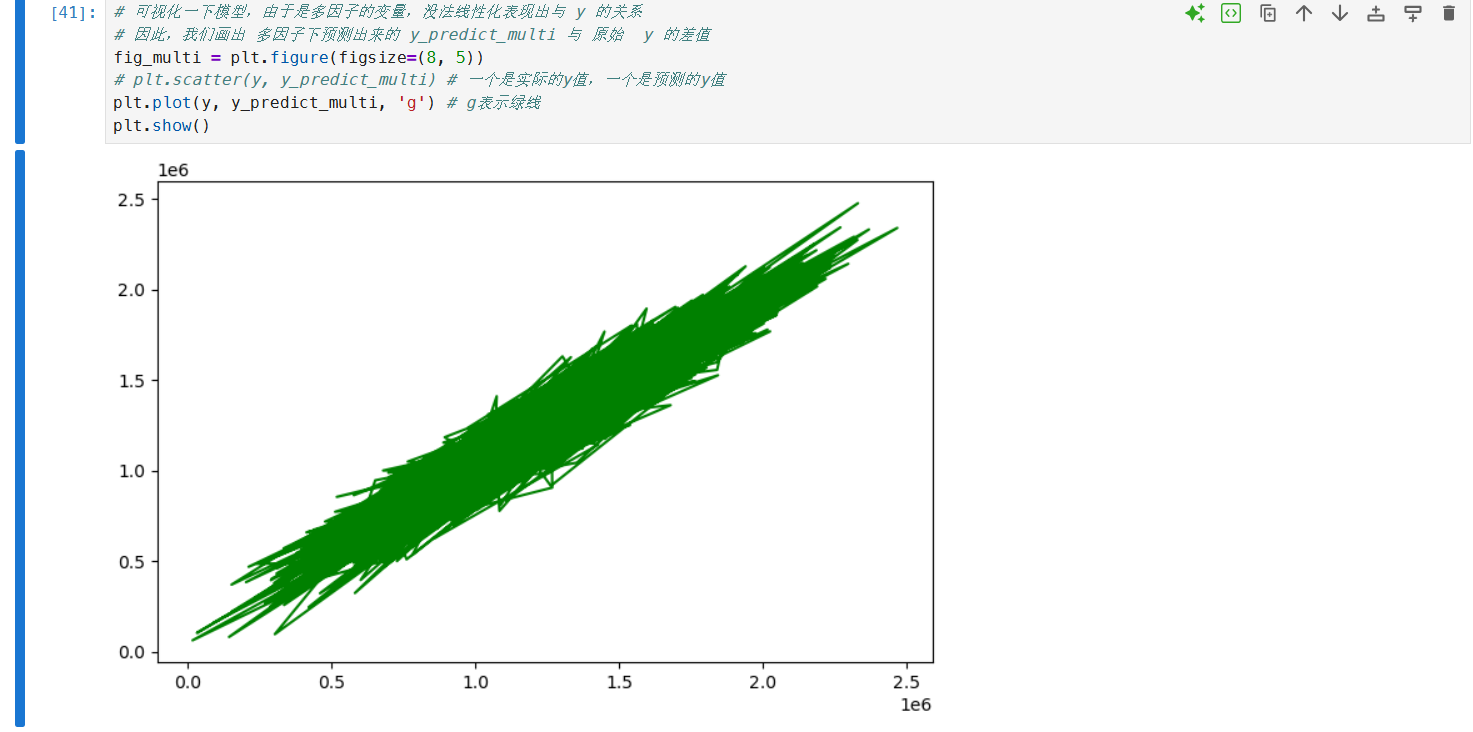
4.6、完成要求的多条件下的预测合理房价#
# 完成目标中要求的实际参数下的 预测房价合理价
# 预测 **Avg. Area Income**=65000,
# **Avg. Area House Age**=5,
# **Avg. Area Number of Rooms**=5,
# **Avg. Area Number of Bedrooms**=5,
# **Area Population**=30000 的合理房价。
x_test = pd.DataFrame([[65000, 5, 5, 5, 30000]],
                      columns=['Avg. Area Income',
                               'Avg. Area House Age',
                               'Avg. Area Number of Rooms',
                               'Avg. Area Number of Bedrooms',
                               'Area Population'])
# # 转换维度
# x_test = np.array(x_test).reshape(1, -1) # 1行多列
# print(x_test)

# 开始根据条件预测
y_test = LR_multi.predict(x_test)
print(y_test)